
DORA Metrics: The Right Fit for ekino?
Assessing Value, Feasibility, and Integration with our Project Health Tools
Study Goal and Scope
This study explores the integration of DORA metrics into ekino’s workflows to assess their practicality and impact on software delivery performance. DORA metrics — deployment frequency, lead time for changes, mean time to restore, and change failure rate — are widely recognized for their ability to provide insights into operational efficiency. However, their value depends on thoughtful implementation and alignment with existing tools and processes.
This study will evaluate these metrics in detail, examining technical and cultural challenges, identifying potential pitfalls, and addressing their limitations. Additionally, it will explore complementary metrics and contextual factors, such as developer sentiment and business outcomes, to create a comprehensive and actionable performance evaluation framework for ekino. The ultimate goal is to deliver recommendations that balance operational improvements with long-term organizational objectives.
Index Terms: DORA Metrics, Deployment Frequency, Lead Time for Changes, Mean Time to Restore, Change Failure Rate, DevOps Performance, Developer Sentiment, Operational Efficiency, Software Delivery, Continuous Improvement, Feature Management, Observability, CI/CD Pipelines.
What Are DORA Metrics?
Definition and Background
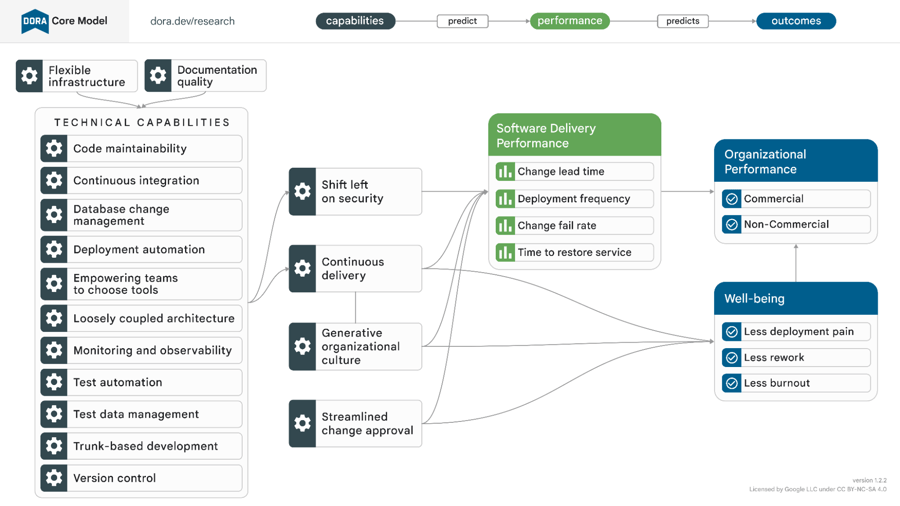
DORA metrics, established by Google’s DevOps Research and Assessment (DORA) group, are a standardized framework designed to measure and enhance software delivery performance. These four key metrics — Deployment Frequency, Lead Time for Changes, Mean Time to Restore, and Change Failure Rate — provide actionable insights into the speed and stability of an organization’s delivery pipeline. By quantifying both throughput and reliability, DORA metrics offer a data-driven approach to optimizing DevOps practices.
Why Were DORA Metrics Created?
The DevOps movement emerged to address the increasing need for faster, more reliable software delivery. Traditionally, organizations struggled to quantify their engineering performance, leading to misaligned goals, inefficiencies, and limited visibility into areas for improvement.
DORA metrics were created to:
- Provide a standardized framework for measuring software delivery performance.
- Bridge the gap between development and operations teams by aligning technical practices with business outcomes.
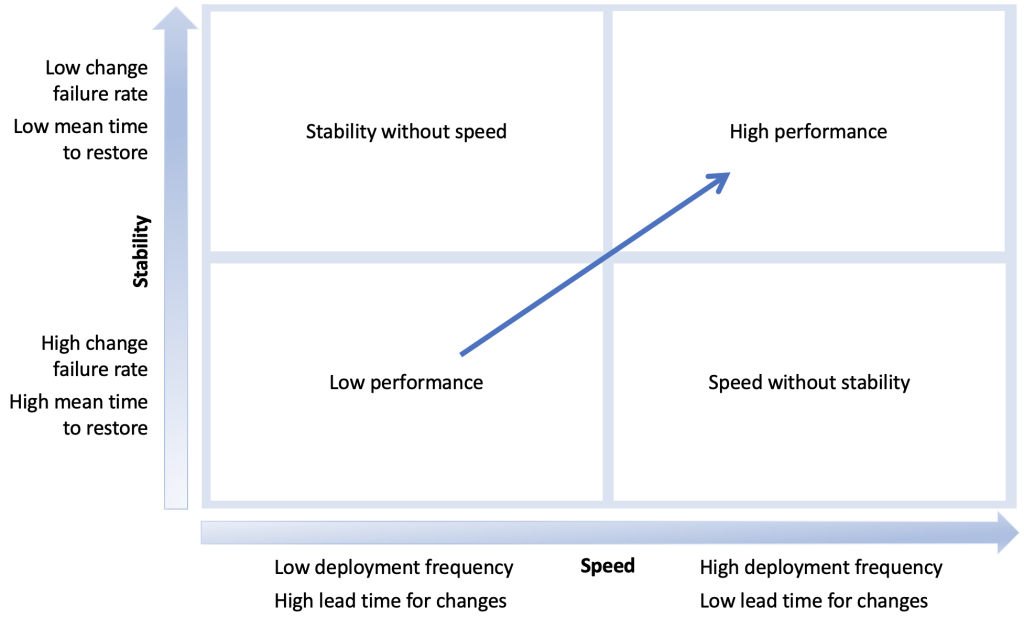
- Focus on the dual objectives of throughput (speed of delivery) and stability (reliability of systems).
By addressing these challenges, DORA metrics serve as a diagnostic tool and benchmark for organizations striving to enhance their DevOps efficiency.
Why Are DORA Metrics Important?
DORA metrics are vital because they enable organizations to:
- Identify Bottlenecks: Pinpoint inefficiencies in the software delivery lifecycle.
- Benchmark Performance: Compare against industry standards to set realistic goals.
- Promote Continuous Improvement: Align engineering metrics with business objectives, driving iterative optimization.
- Balance Speed and Stability: Ensure frequent and reliable delivery without sacrificing quality.
Beyond technical measures, DORA metrics also foster cultural and organizational improvements:
- High-Trust Cultures: Teams with strong collaboration, psychological safety, and learning practices perform better across DORA metrics.
- Feedback Loops: Iterative reviews and adjustments ensure sustained improvements and alignment with evolving goals.
DORA metrics have been recognized as a critical driver of success, correlating with improved business outcomes, team collaboration, and operational efficiency.
The Four Core DORA Metrics and Their Formulas
The DORA framework is built around four metrics that capture both speed and stability, offering a comprehensive view of software delivery performance:
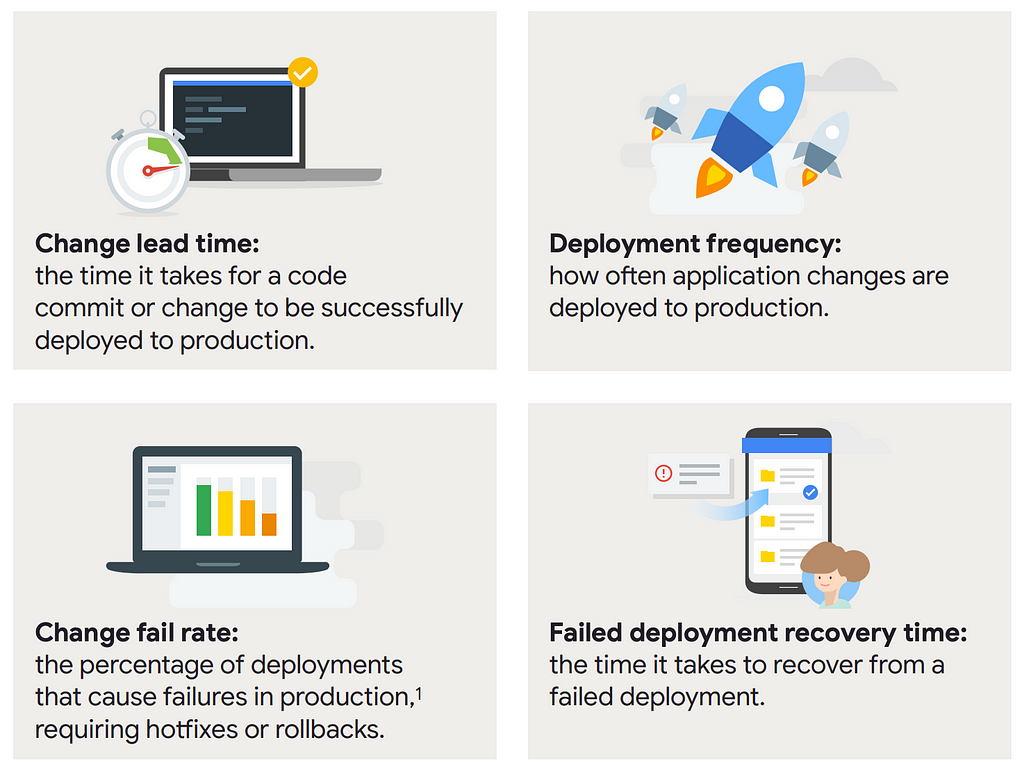
1️⃣ Deployment Frequency: Measures how often software is deployed to production.
Deployment Frequency = Number of Deployments / Time Period
✔️ High frequency indicates the team’s ability to deliver value rapidly.
2️⃣ Lead Time for Changes: Tracks the time from a code commit to successful deployment in production.
Lead Time for Changes = Time of Deployment - Time of Code Commit
✔️ Shorter lead times reflect efficient processes and faster value delivery.
3️⃣ Mean Time to Restore: The average time to recover from a failure in production.
MTTR = Total Time to Restore Services / Number of Incidents
✔️ Low MTTR indicates robust incident response capabilities.
4️⃣ Change Failure Rate: The percentage of deployments causing failures in production.
Change Failure Rate = (Failed Deployments / Total Deployments) * 100
✔️ Low failure rates suggest reliable deployment practices.
Performance Levels in DORA Metrics
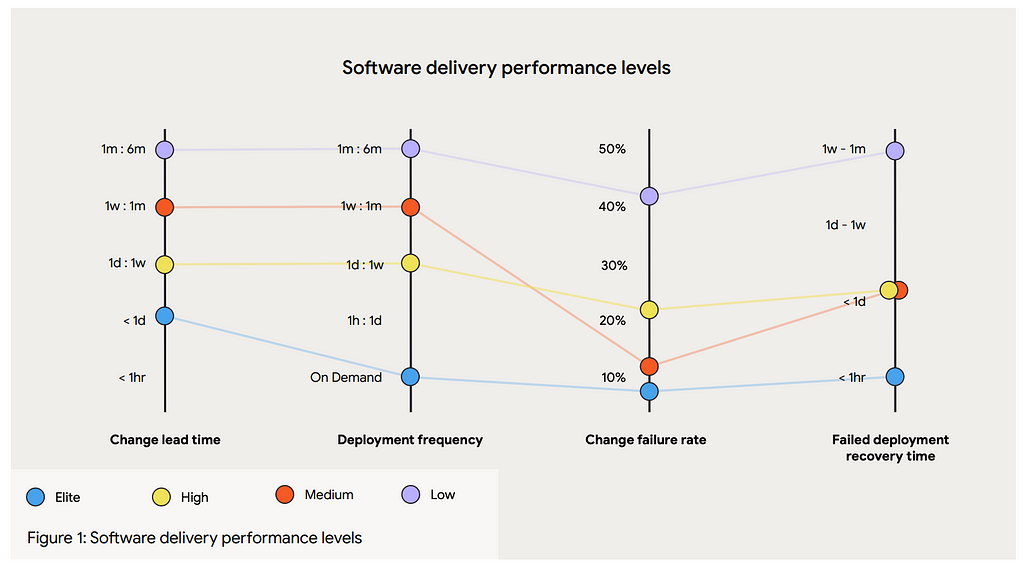
The DORA metrics framework categorizes teams into four performance levels — Elite, High, Medium, and Low — based on thresholds across the four core metrics. These levels serve as benchmarks, enabling organizations to understand their current standing and identify improvement areas.
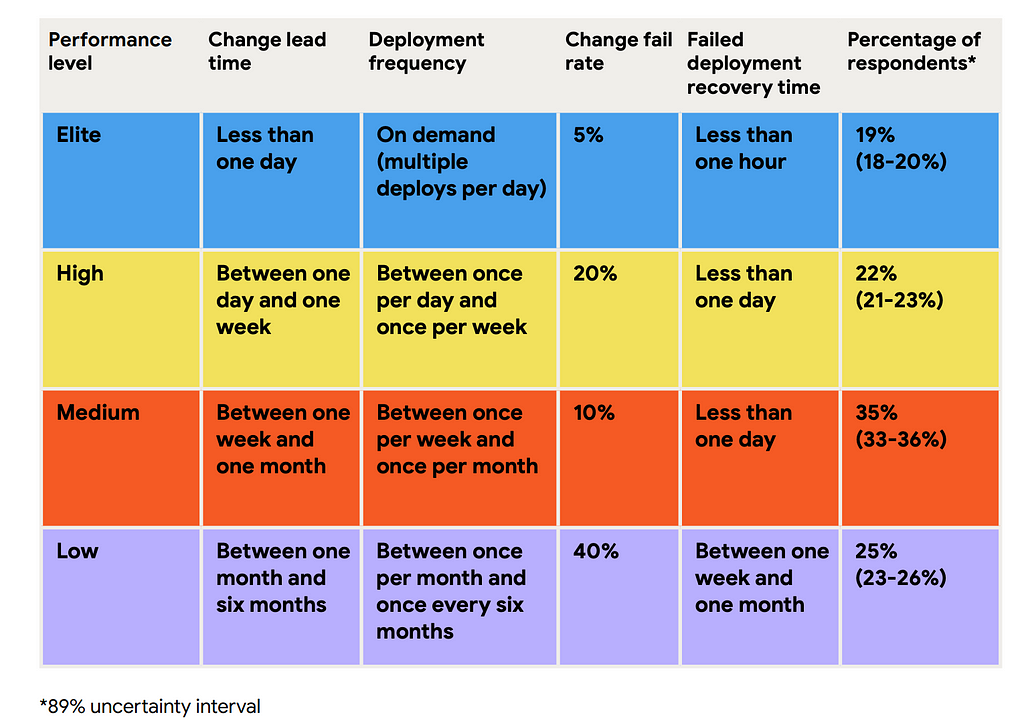
🔵 Elite Performers:
- Key Metrics: Multiple daily deployments, lead times under 1 hour, recovery in less than 1 hour, failure rate 0–15%.
- Impact: Deliver 182x more frequently and recover 2,293x faster than low performers.
🔶 High Performers:
- Key Metrics: Daily/weekly deployments, lead times 1 day to 1 week, recovery in under 1 day, failure rate 0–15%.
- Strengths: Consistently deliver value with strong workflows
🔴 Medium Performers:
- Key Metrics: Weekly to monthly deployments, lead times 1 week to 1 month, recovery in under 1 week, failure rate 16–30%.
- Challenges: Workflow inefficiencies slow delivery.
🆔 Low Performers:
- Key Metrics: Monthly to semi-annual deployments, lead times over 1 month, recovery longer than 1 week, failure rate >30%.
- Impact: Struggle to deliver value efficiently.
Key Statistics and Insights
The 2024 DORA report highlights the tangible impact of these metrics:
- Elite performers deploy changes 182x more frequently, recover from failures 2,293x faster, and have 127x faster lead times compared to low-performing teams.
- High performers account for 19% of respondents, deploying daily or weekly and achieving lead times of 1 day to 1 week.
- Medium performers represent 22% and deploy weekly to monthly, while low performers (25%) face lead times exceeding one month.
DORA’s Implementation Strategies
Internal Implementation Process
The successful implementation of DORA metrics in a DevOps environment involves adopting a strategic approach to automate data collection, calculate key metrics, visualize performance, and create a feedback-driven culture. Below is a detailed framework for implementing DORA metrics, inspired by best practices and case studies.

1️⃣ Automate Data Collection: Enable accurate, real-time, and comprehensive data tracking.
🔘 Identify Signal Sources:
- Source Control: Track commits, merges, and pull requests (GitHub, GitLab).
- CI/CD Pipelines: Capture deployments, test failures, and rollbacks (Jenkins, CircleCI).
- Deployment Tools: Monitor releases and rollbacks (Octopus Deploy).
- Incident Tracking: Log MTTR and issue resolutions (PagerDuty, Datadog).
- Database Systems: Record schema changes, migrations, and query performance.
🔘 Integrate Automatic Emitters: Leverage event mechanisms from cloud providers (AWS CodeBuild, Google Cloud Build) or CI/CD tools to ensure real-time data tracking.
2️⃣ Metrics Aggregation and Calculation: Centralize signals and compute actionable metrics.
- Data Centralization: Consolidate signals in platforms like BigQuery or Elasticsearch.
- Automated Jobs: Process data daily to compute metrics such as Deployment Frequency (Deployments / Time Period ) and MTTR (Time to Restore / Incidents ).
- Standardized Logic: Use predefined rules for consistent metric calculations.
3️⃣ Visualization: Translate metrics into intuitive, actionable insights.
- Dashboards: Use tools like Grafana or Tableau to visualize trends and anomalies.
- Custom Views: Contextualize metrics by linking them to teams, commits, or environments.
- Balanced Data: Include drill-down capabilities to explore anomalies and outliers.
3️⃣ Establish Feedback Loops: Enable continuous learning and improvement.
- Collaborative Reviews: Conduct retrospectives to discuss metrics and address bottlenecks.
- Iterative Refinement: Use insights to optimize processes, implement feature flags, and mitigate risks.
- Adaptive Benchmarks: Update goals and thresholds as teams evolve.
4️⃣ Cultural Integration: Align metrics with team values and goals.
- Build Trust: Encourage open communication and psychological safety when analyzing metrics.
- Celebrate Successes: Recognize improvements in areas like deployment frequency or reduced failure rates.
- Promote DevOps Values: Reinforce shared ownership and collaboration between teams.
By following this framework, teams can seamlessly integrate DORA metrics into their workflows, unlocking actionable insights and fostering a culture of continuous improvement and operational excellence.
Tools for DORA Metrics Implementation
Below is a detailed comparison of popular tools for implementing DORA metrics, including their usage, licensing, advantages, disadvantages, and examples of use cases:
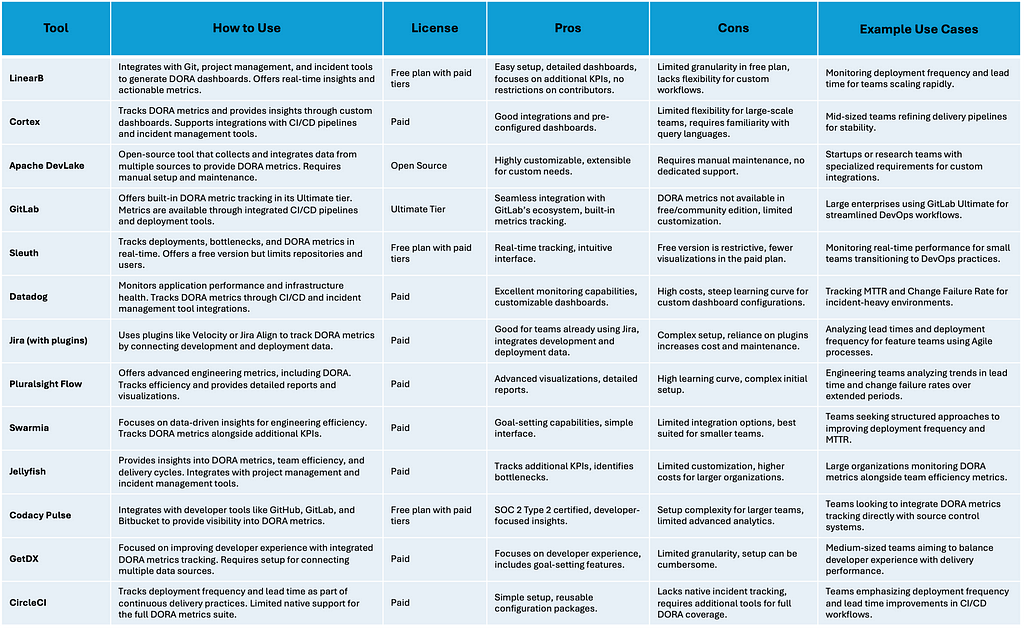
Choosing the right DORA metrics tool depends on your team’s specific needs, balancing factors like ease of integration, automation capabilities, scalability, and cost, with open-source options like Apache DevLake offering flexibility and customization, while paid solutions like LinearB and Sleuth provide streamlined, out-of-the-box insights for performance optimization.
📍 More details about DORA tools can be found on LinearB blog.
Integrating DORA Metrics with ekino’s v6y Tool
At ekino, Vitality (v6y) serves as the central platform for collecting, analyzing, and displaying DORA metrics by leveraging internal tools such as Content Square, Datadog, and GitLab. Here’s a tailored implementation approach:
1️⃣ Data Collection: Utilize REST APIs or GraphQL APIs exposed by internal tools to collect signals:
- GitLab: Retrieve data on commits, merge requests, and deployments to calculate metrics such as Deployment Frequency and Lead Time for Changes.
- DataDog: Track production incidents, monitor alerts, and log issue resolutions to calculate Mean Time to Restore and Change Failure Rate.
- Content Square (Optional): Monitor customer-facing impacts for enriched context and deeper insights into production changes.
2️⃣ Business Feedback Brain (BFB) Logic for Analysis: Implement a BFB in v6y to:
- Automatically recognize patterns indicating “good” or “bad” DORA metric symptoms for each project.
- Enrich this analysis with contextual data such as historical trends, root cause links, and improvement suggestions.
- Store processed data in a centralized database with metadata like helpful messages, links, and recommendations for remediation.
3️⃣ Frontend Data Presentation: Extend v6y’s frontend to:
- Display DORA metrics in intuitive dashboards, including trends, alerts, and per-project health summaries.
- Highlight actionable insights, such as high Change Failure Rates or slow Lead Time for Changes, with contextual links to related incidents or commits.
- Provide a project-specific “health score” and offer guidance for improvement directly to end users.
4️⃣ Integration with Workflows:
- Enable real-time notifications in v6y for significant DORA metric deviations (e.g., exceeding MTTR thresholds).
- Integrate DORA insights into team retrospectives and planning sessions to continuously refine workflows.
┌──────────────────┐       ┌───────────────────────┐
│                  │       │                       │
│  BFB Main        │       │  BFB Frontend         │
│  Analyzer        │──────▶│  Auditor              │
│                  │       │                       │
└──────────────────┘       └───────────────────────┘
       │                          │
       │                          │
       ▼                          ▼
┌────────────────────────────────────────┐
│                                        │
│              Persistence               │
│                                        │
└────────────────────────────────────────┘
       ▲                          ▲
       │                          │
       │                          │
┌──────┴──────────────────────────┴──────┐
│                                        │
│             BFF (R/W)                  │
│             (GraphQL, Node.js)         │
│                                        │
└────────────────────────────────────────┘
         ▲                  ▲
         │                  │
         │                  │
         ▼                  ▼
    ┌───────────────────┐  ┌──────────────────────────┐
    │                   │  │                          │
    │ Frontend (IHM)    │  │ Frontend (BO)            │
    │ (React, GraphQL)  │  │ (React, GraphQL, Refine) │
    │                   │  │                          │
    └───────────────────┘  └──────────────────────────┘
This integration ensures v6y becomes a robust project health tool, leveraging DORA metrics to provide actionable, context-aware insights that drive continuous improvement across ekino’s projects.
Challenges of Implementing DORA Metrics
Technical Barriers
Integrating DORA metrics into existing systems is often hindered by technical challenges, such as:
- Fragmented Data Sources: Signals are dispersed across tools like GitLab, Content Square, and Datadog, requiring unified APIs or middleware for collection.
- API Limitations: Not all tools expose the required data, necessitating workarounds or custom integrations.
- Data Quality Issues: Inconsistent logging practices or incomplete data can skew metric calculations, reducing reliability.
- Scaling Challenges: Large projects generate high volumes of data, making real-time aggregation and visualization resource-intensive.

Cultural Resistance
Cultural barriers can impede the adoption of DORA metrics:
- Misaligned Goals: Teams may view metrics as punitive rather than tools for improvement, fostering resistance.
- Lack of Buy-In: Without strong leadership support, teams may deprioritize the changes required to adopt DORA practices.
- Fear of Transparency: Engineers may be hesitant to expose bottlenecks or failures, fearing blame or repercussions.
Operational Complexity
Operational challenges arise when incorporating DORA metrics into workflows:
- Workflow Disruption: Initial integration may disrupt daily processes, causing delays or confusion.
- Balancing Priorities: Teams may struggle to balance metric improvement with feature delivery.
- Tool Overhead: Managing multiple tools for data collection, analysis, and visualization can create additional operational burdens
Why DORA Metrics Alone Are Not Sufficient
DORA metrics provide valuable insights but cannot address all aspects of software delivery performance:
- Limited Context: Metrics like Change Failure Rate highlight symptoms but do not identify root causes.
- Blind Spots: Metrics overlook qualitative factors like developer sentiment, team dynamics, and user experience.
- No One-Size-Fits-All: Metric thresholds vary by organization; what defines “elite” for one team may not suit another.
Common Pitfalls in DORA Metrics
Teams often encounter pitfalls that undermine the effectiveness of DORA metrics:
- Over-Focusing on Metrics: Excessive focus on improving numbers can lead to gaming metrics or sacrificing quality.
- Ignoring Long-Tail Issues: Averaging metrics like MTTR may mask significant outliers, obscuring critical problems.
- Static Benchmarks: Rigidly adhering to industry benchmarks without considering organizational context can misguide efforts.
- Lack of Continuous Improvement: Viewing metrics as a one-time initiative rather than a dynamic process limits long-term value.

Final Decision: Pros, Cons, and Tradeoffs
Implementing DORA metrics provides valuable insights into software delivery performance, but their adoption must be weighed against the challenges and limitations. Below is a structured evaluation to guide decision-making.
1️⃣ Pros:
- Data-Driven Insights: Quantifies key metrics like Deployment Frequency and MTTR to identify bottlenecks and drive targeted improvements.
- Alignment with Business Goals: Connects technical performance with business outcomes, enabling strategic, value-driven decision-making.
- Enhanced Collaboration: Facilitates cross-functional alignment and continuous improvement through shared performance metrics.
- Automation Opportunities: Streamlines workflows by automating testing, deployments, and incident responses, reducing manual effort.
2️⃣ Cons:
- Initial Setup and Maintenance Costs: Integration with tools like GitLab or Datadog requires APIs and custom logic, with ongoing resource demands for maintenance.
- Data Integrity Challenges: Incomplete or inconsistent data can skew metrics, requiring robust validation and error handling.
- Limited Contextual Depth: Metrics like Change Failure Rate lack root cause insights, risking a focus on numbers over meaningful outcomes.
- Cultural Hurdles: Resistance to metrics as non-punitive tools and shifting mindsets toward improvement requires leadership support and careful change management.
3️⃣ Tradeoffs:
- Simplicity vs. Depth: DORA offers high-level insights but may require additional KPIs for complex systems, increasing context and complexity.
- Automation vs. Flexibility: Automating data collection enhances efficiency but may reduce adaptability for unique team needs.
- Immediate Impact vs. Long-Term Gains: Initial setup can delay results, but long-term use yields compounding benefits.
- Team Performance vs. Individual Productivity: Team-focused metrics may overshadow individual contributions; a balance is essential for fair evaluations.
The decision to adopt DORA metrics must consider these tradeoffs and align with organizational priorities. While DORA provides a robust starting point for performance measurement, its success depends on proper implementation, continuous refinement, and integration into broader organizational goals. Leveraging tools like v6y can ensure a tailored and scalable approach, turning challenges into opportunities for long-term improvement.
Conclusion
Adopting DORA metrics at ekino represents a thoughtful step toward enhancing software delivery practices by embedding data-driven decision-making into everyday workflows. These metrics, while offering clear benefits in identifying bottlenecks and driving improvements, require careful integration to account for unique organizational contexts and technical landscapes.
Through Vitality (v6y), ekino has the potential to create a tailored implementation that not only measures performance but also provides actionable insights rooted in real-time data from internal tools. However, it is essential to approach this initiative with a recognition of its challenges — balancing automation and flexibility, ensuring data quality, and fostering a culture of collaboration and improvement.
Ultimately, DORA metrics are not a standalone solution but a foundation to build upon. With thoughtful implementation, continuous refinement, and alignment to organizational objectives, they can help ekino achieve meaningful and sustainable advancements in both technical operations and team dynamics.
That’s All, Folks! 🚀
Thank you for exploring DORA metrics and their transformative potential at ekino. ❤️
Want to Connect?
You can find me at GitHub: https://github.com/helabenkhalfallah
DORA Metrics: The Right Fit for Ekino? was originally published in ekino-france on Medium, where people are continuing the conversation by highlighting and responding to this story.