
Practical Insights for ekino’s Next.js Applications

Abstract
Observability is essential for diagnosing and optimizing the performance of modern web applications. This study examines how OpenTelemetry (OTel) can be integrated with Next.js to address observability challenges in the context of Ekino’s workflows. OpenTelemetry provides a vendor-neutral framework for collecting and unifying traces, metrics, and logs, simplifying system monitoring and debugging.
The study focuses on monitoring critical Next.js features, including server-side rendering (SSR), static site generation (SSG), and API routes, while addressing Ekino-specific requirements for efficient instrumentation and telemetry data visualization. By exploring technical setup, instrumentation strategies, and performance considerations, this study offers actionable insights to enhance reliability, debugging efficiency, and user experience in Next.js applications.
Index Terms: OpenTelemetry, Observability, Next.js, Ekino, Performance Monitoring, Metrics, Logging, Tracing Protocols, Debugging.
Introduction
State of Observability
Observability has emerged as a critical pillar in modern software engineering, providing actionable insights into increasingly complex systems. As architectures evolve to include cloud-native microservices, Kubernetes, and hybrid infrastructures, traditional monitoring tools often fall short. Observability bridges this gap by unifying traces, metrics, and logs, delivering a holistic view of system health, performance, and user experience.
The benefits are significant:
- 58% of organizations report over $5 million in annual value from observability investments.
- A median ROI of 4x demonstrates its cost-effectiveness.
- Organizations achieve improved system uptime (46%), enhanced operational efficiency (42%), and reduced security risks (39%).

However, observability practices remain fragmented. 88% of organizations rely on multiple tools, with 45% using five or more. This complexity underscores the need for standardization and unified observability frameworks.

The Rise of OpenTelemetry
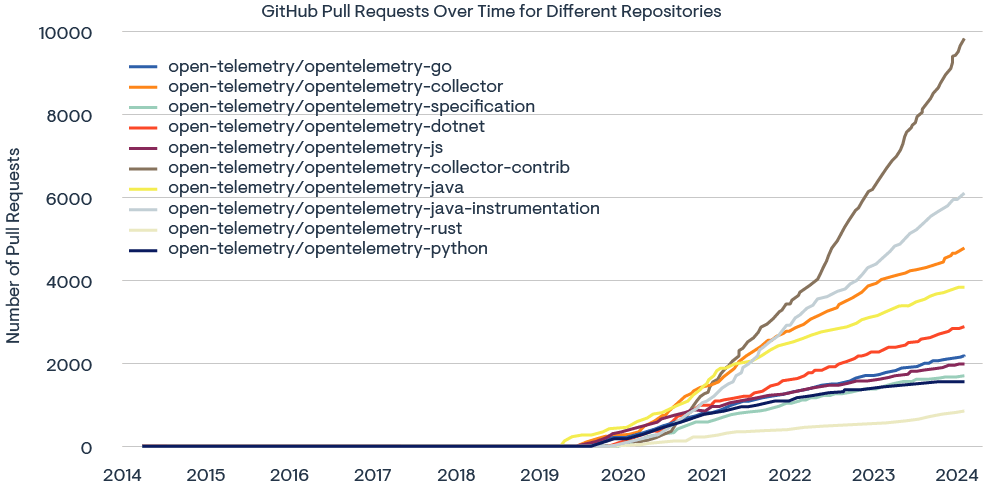
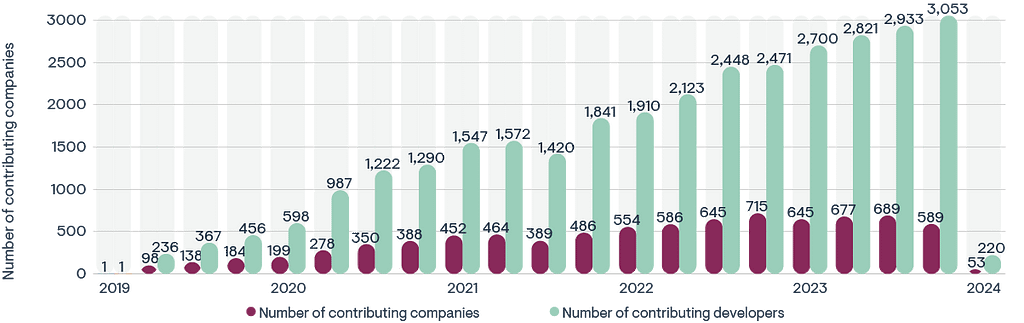
OpenTelemetry has emerged as the industry standard for modern observability, providing a unified, open-source framework for collecting, processing, and exporting telemetry data. Backed by the CNCF (Cloud Native Computing Foundation), OpenTelemetry has experienced exponential growth:
- Supported by 10,000 contributors from 1,200 companies, with 900 developers actively contributing monthly (an 18% YoY* increase).
- A 445% annual surge in Python library downloads (reaching 21 million in December 2023).
- Over 40% YoY* growth in GitHub pull requests, signaling widespread adoption.
With its unified protocol (OTLP), OpenTelemetry simplifies observability by standardizing metrics, traces, and logs, reducing tool fragmentation, enhancing data consistency, and enabling seamless integration across diverse systems.
*YoY: Year-over-Year.
OpenTelemetry’s Role in Addressing Web Observability
Modern web applications operate in distributed environments, posing challenges in performance, reliability, and user experience. Frameworks like Next.js introduce unique observability complexities due to features like:
- Hybrid Execution Environments: Tracing workflows across serverless functions and traditional infrastructure.
- Frontend-Backend Correlation: Linking client-side interactions to backend responses for comprehensive insights.
- Dynamic Scaling: Detecting bottlenecks as traffic demands fluctuate.
OpenTelemetry addresses these challenges by enabling end-to-end visibility across the Next.js ecosystem. By integrating seamlessly with both frontend and backend systems, OpenTelemetry delivers:
- Automatic instrumentation for monitoring SSR, APIs, and frontend performance.
- Distributed tracing to connect user interactions with infrastructure metrics.
- Toolchain compatibility, supporting cloud platforms (e.g., AWS, Vercel) and observability tools like Prometheus and Grafana.
This unified approach empowers us to optimize web application performance, minimize latency, and ensure seamless user experiences.
Objective and Scope of the Study
The objective of this study is to examine how OpenTelemetry addresses the observability challenges of modern web applications, particularly in frameworks like Next.js. The scope includes:
- Analyzing key challenges in hybrid web architectures.
- Evaluating OpenTelemetry’s role in unifying telemetry data for end-to-end visibility.
- Demonstrating integration strategies for Next.js to enhance performance, reliability, and scalability.
This study aims to provide practical insights and recommendations for organizations seeking to implement OpenTelemetry to meet the demands of modern web observability.
The Technical Backbone of OpenTelemetry
Principles of Observability
In modern IT and cloud computing, observability refers to the ability to infer the internal state of a system by analyzing the external outputs it generates. It provides the visibility required to troubleshoot, optimize, and maintain distributed, cloud-native systems effectively.

At its core, observability is built upon three fundamental components — often referred to as the three pillars of observability — that collectively offer a complete view of system health:

1️⃣ Logs: Logs are detailed, timestamped records of events within a system. They provide vital context for debugging and auditing processes by capturing discrete events and their associated metadata. Logs can be:
- Structured (e.g., JSON, for machine parsing)
- Unstructured (e.g., plain text, for human readability)
🔳 Example:
2023-11-20 10:15:32 INFO  UserService: Starting getUserById for userId=12345
2023-11-20 10:15:35 ERROR UserService: Failed to send email to userId=12345
2️⃣ Metrics: Metrics are numerical measurements that quantify system performance over time. Metrics are aggregated and monitored for trends, such as CPU utilization, request latency, or error rates.
🔳 Example:
http_requests_total{method="post",code="200"} 1027
node_memory_MemAvailable_bytes 2.147483648e+09
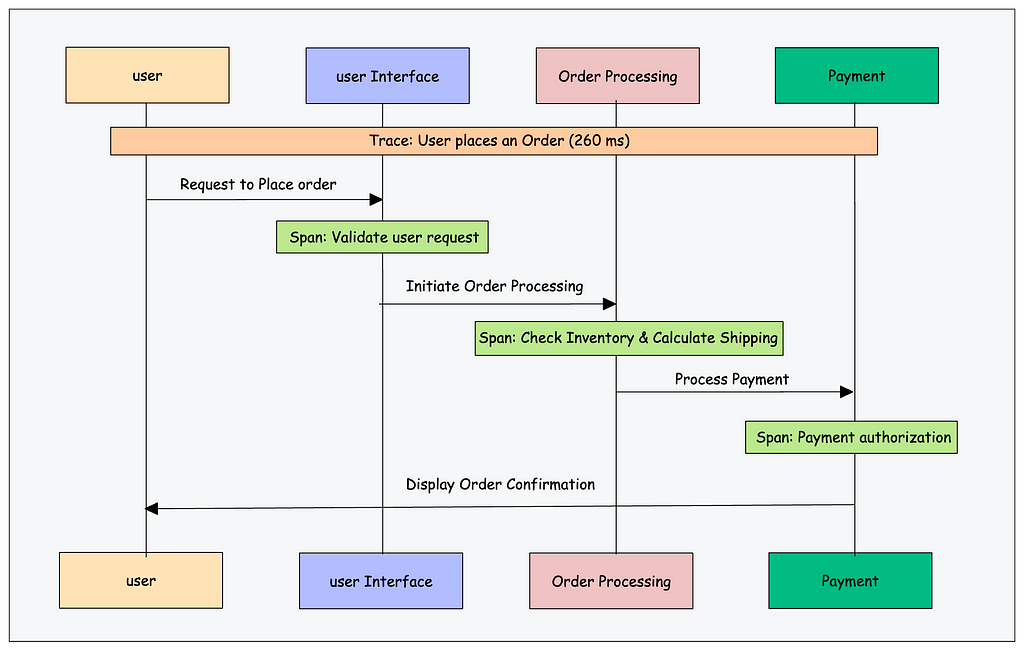
3️⃣ Traces: Traces track the flow of a request through a distributed system, helping teams identify latency sources, service interdependencies, and potential bottlenecks. Traces are made up of spans, which represent individual units of work.
- Root Span: Represents the start of a request.
- Child Spans: Represent sub-tasks, such as a database query or API call.
Distributed tracing connects these spans to provide an end-to-end view of system interactions.
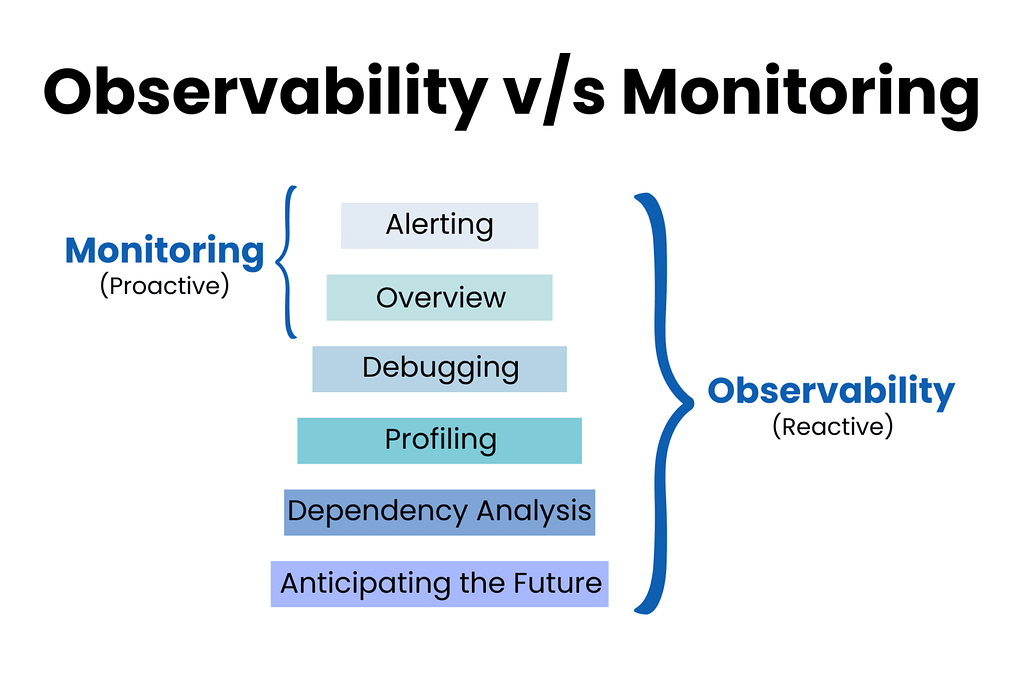
While monitoring answers the question “What went wrong?”, observability helps answer “Why did it happen?”.
- Monitoring involves preconfigured thresholds, dashboards, and alerts to detect known issues (known unknowns).
- Observability enables flexible analysis to uncover the unknown unknowns by combining logs, metrics, and traces.
This investigative capability is especially critical in cloud-native systems, where the complexity and unpredictability of distributed environments require deep visibility and dynamic insights.
OpenTelemetry as the Unified Standard
As systems grow and become more complex, standardized telemetry collection becomes critical. OpenTelemetry (OTel), a CNCF-backed open-source project, provides a vendor-neutral framework for unified telemetry data — logs, metrics, and traces.

Why OpenTelemetry?
1️⃣ Standardized Instrumentation: OTel introduces the OpenTelemetry Protocol (OTLP), a single protocol that eliminates tool fragmentation and vendor lock-in.
2️⃣ Seamless Integration: OpenTelemetry integrates with leading observability tools, such as:
- Prometheus (metrics collection)
- Jaeger (tracing)
- Grafana (visualization)
- Cloud providers like AWS and Azure
This ensures organizations can maintain their existing observability stack while benefiting from OTel’s capabilities.

3️⃣ Extensibility: With components like the OpenTelemetry Collector, organizations can process, filter, and export telemetry data to multiple backends.
By adopting OpenTelemetry, organizations can unify their observability practices, streamline telemetry collection, and achieve deeper visibility into modern IT environments.
OpenTelemetry Architecture and Pipeline
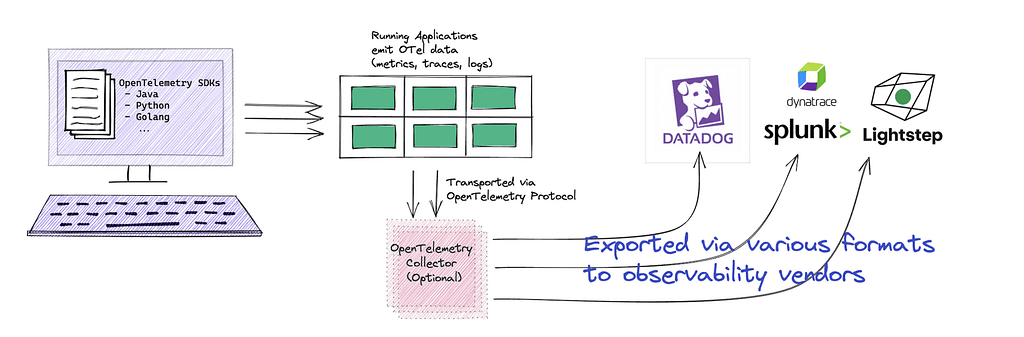
⚫ The OpenTelemetry architecture consists of the following components:
- APIs and SDKs: Libraries for instrumenting code to emit telemetry data (logs, metrics, and traces).
- OTel Collector: A processing layer for ingesting, filtering, and exporting telemetry data.
- Exporters: Components that forward telemetry data to observability backends.

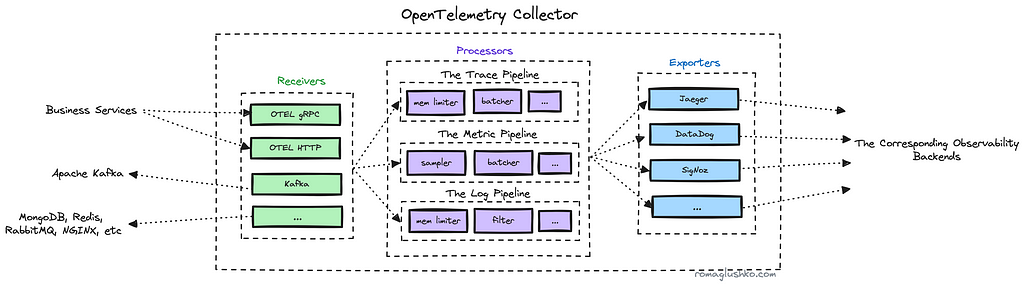
⚫ The OpenTelemetry Collector consists of three primary components:

1️⃣ Receivers
- Purpose: Ingest telemetry data into the Collector.
- Modes: Push-based (data sent) or Pull-based (data fetched).
- Supported Sources: OTLP, Prometheus, Jaeger, Zipkin, and more.
- Example: Collecting metrics from Prometheus or traces via OTLP.
2️⃣ Processors
- Purpose: Modify, optimize, or enrich telemetry data before export.
- Common Tasks: Batching (Group data to improve efficiency), Sampling (Reduce telemetry volume) and Enrichment (Add metadata for context).
- Example: Adding an environment attribute or grouping trace spans.
3️⃣ Exporters
- Purpose: Send telemetry data to one or more backends.
- Supported Destinations: Prometheus, Jaeger, Elasticsearch, cloud platforms (AWS, Azure, GCP), and logging tools.
- Example: Exporting traces to Jaeger and metrics to Prometheus.
⚫ The pipeline in the OpenTelemetry Collector defines the end-to-end data flow:

It specifies how telemetry data is:
- Received via Receivers
- Processed using Processors
- Exported to Observability Backends
🔳 Example Pipeline Configuration:
service:
  pipelines:
    traces:
      receivers: [otlp, jaeger]
      processors: [batch, attributes]
      exporters: [jaeger, logging]

    metrics:
      receivers: [prometheus]
      processors: [batch]
      exporters: [prometheus]

    logs:
      receivers: [otlp]
      processors: [batch]
      exporters: [elasticsearch, logging]
In this example:
- Traces are ingested using OTLP and Jaeger, processed in batches, and sent to Jaeger and logging backends.
- Metrics are scraped via Prometheus, processed, and exported to Prometheus.
- Logs are received via OTLP and exported to Elasticsearch and logging tools.
This flexibility ensures that organizations can route telemetry data to multiple systems based on their use cases.
⚫ The OpenTelemetry Collector serves as the backbone of a unified observability pipeline, addressing the complexities of multi-format telemetry collection and distribution. By offering a modular architecture, it allows teams to:
- Integrate seamlessly with existing observability tools
- Optimize telemetry processing (batching, sampling, enrichment)
- Export telemetry data to multiple platforms efficiently
With its vendor-neutral approach and extensible configuration, the OpenTelemetry Collector simplifies telemetry management, ensuring observability across modern, cloud-native infrastructures.
We now turn our focus to how observability can be effectively applied to Next.js applications, tackling the complexities of modern web performance and reliability. 🚀
Next.js and Observability
Observability Challenges in Next.js Applications
Modern web applications built with Next.js require robust observability to ensure optimal performance, reliability, and user experience. The framework’s hybrid architecture — combining server-side rendering (SSR), static site generation (SSG), and dynamic client-side interactions — introduces unique complexities that necessitate end-to-end visibility across the stack.
Key observability needs for Next.js include:
- Tracing Across Environments: Seamlessly linking client-side interactions with server-side API routes, serverless functions, and edge infrastructure.
- Performance Optimization: Pinpointing slow renders, inefficient API calls, and caching issues to enhance responsiveness.
- Infrastructure Integration: Monitoring deployments across platforms like Vercel, AWS, and edge networks to identify bottlenecks and improve resource allocation.

To address these challenges, distributed tracing plays a pivotal role. Traces represent the journey of a request through a Next.js application, breaking it into granular spans — individual units of work — across various services and environments. By collecting and analyzing spans, teams gain insight into latency sources, dependency failures, and overall request performance.
Built-in Observability Features in Next.js
Next.js provides robust tools to improve observability, enabling developers to monitor, debug, and optimize their applications effectively. These features focus on logging, performance monitoring, and flexible middleware to address observability challenges.
1️⃣ Web Vitals Reporting: Next.js natively supports Web Vitals to measure real-world performance (Web Vitals), such as First Contentful Paint (FCP) and Largest Contentful Paint (LCP). These metrics help identify areas impacting user experience.
'use client'

import { useReportWebVitals } from 'next/web-vitals'

export function WebVitals() {
  useReportWebVitals((metric) => {
    switch (metric.name) {
      case 'FCP': {
        // handle FCP results
      }
      case 'LCP': {
        // handle LCP results
      }
      // ...
    }
  })
}
2️⃣ Instrumentation for Performance Monitoring: Instrumentation enables integration with monitoring tools like OpenTelemetry to capture performance metrics, traces, and logs. Next.js supports instrumentation through a dedicated file that runs once when the server starts.
// instrumentation.ts
import { registerOTel } from '@vercel/otel';

export function register() {
  registerOTel('next-app'); // Initialize OpenTelemetry for Next.js
}
3️⃣ Middleware for Observability: Middleware in Next.js allows running code before requests are completed, enabling observability tasks such as:
- Logging and Analytics: Capturing request data for insights.
- Feature Flagging: Dynamically enabling or disabling features.
- Path Rewriting: Redirecting traffic for A/B testing or legacy routes.
- Authentication: Validating user sessions before processing requests.
// middleware.ts

import { NextResponse } from 'next/server';

export function middleware(request) {
  console.log('Incoming request:', request.nextUrl.pathname);
  return NextResponse.next();
}
4️⃣ Custom Logging for Data Fetching: Next.js enables fine-grained logging of fetch requests during development to identify bottlenecks and debug API calls efficiently.
// next.config.js
module.exports = {
  logging: {
    fetches: {
      fullUrl: true, // Log the full URL of fetch requests
      hmrRefreshes: true, // Log cache refreshes during HMR
    },
  },
};
While Next.js offers foundational observability features, it integrates seamlessly with industry-standard tools for deeper visibility:
- OpenTelemetry: Unified collection of logs, metrics, and traces.
- Vercel Analytics: Built-in performance monitoring and insights.
- Prometheus & Grafana: Metrics collection and visualization.
- Jaeger or Zipkin: Distributed tracing for microservices.
By combining Next.js’ native capabilities with external observability tools like OpenTelemetry, we can achieve end-to-end visibility into application performance, infrastructure, and user experience.
OpenTelemetry in Action: Integrating with Next.js
Integrating OpenTelemetry into a Next.js application requires several steps, starting with instrumentation setup and progressing to configuring OpenTelemetry Collectors for advanced telemetry management.
1️⃣ To begin, we need to install the required packages:
npm install @vercel/otel @opentelemetry/sdk-logs @opentelemetry/api-logs @opentelemetry/instrumentation
2️⃣ Next, let’s create an instrumentation.ts file in the project root (or /src if we use a src folder) to register OpenTelemetry:
import { registerOTel } from '@vercel/otel';

export function register() {
  registerOTel({
    serviceName: 'next-app',
  });
}
This initializes OpenTelemetry with a basic configuration using the @vercel/otel package.
3️⃣ While @vercel/otel simplifies instrumentation, we might need manual setup for advanced use cases requiring more flexibility and control.
✔️ For a manual configuration, we need to install the necessary OpenTelemetry packages:
npm install @opentelemetry/sdk-node @opentelemetry/resources @opentelemetry/semantic-conventions
@opentelemetry/sdk-trace-node @opentelemetry/exporter-trace-otlp-http
✔️ We separate instrumentation for Node.js environments into a dedicated file (instrumentation.node.ts):
// instrumentation.node.ts

import { NodeSDK } from '@opentelemetry/sdk-node';
import { Resource } from '@opentelemetry/resources';
import { OTLPTraceExporter } from '@opentelemetry/exporter-trace-otlp-http';
import { SEMRESATTRS_SERVICE_NAME } from '@opentelemetry/semantic-conventions';

const traceExporter = new OTLPTraceExporter({
  url: 'http://localhost:4317/v1/traces', // Update based on your OpenTelemetry collector
});

const sdk = new NodeSDK({
  resource: new Resource({
    [SEMRESATTRS_SERVICE_NAME]: 'next-app',
  }),
  traceExporter,
});

sdk.start();
✔️ We ensure the file loads conditionally in instrumentation.ts:
// instrumentation.ts

export async function register() {
  if (process.env.NEXT_RUNTIME === 'nodejs') {
    await import('./instrumentation.node');
  }
}
4️⃣ Setting Up the OpenTelemetry Collector: The OpenTelemetry Collector acts as a centralized hub to receive, process, and export telemetry data.
✔️ We can spin up the OpenTelemetry Collector locally using Docker:
docker run -p 4317:4317 -p 4318:4318
  -v $(pwd)/otel-config.yaml:/etc/otel/config.yaml
  otel/opentelemetry-collector-contrib:latest
✔️ We define how telemetry data is received, processed, and exported in the otel-config.yaml file:
receivers:
  otlp:
    protocols:
      grpc:
      http:

processors:
  batch:
    timeout: 5s
    send_batch_size: 512

exporters:
  logging:
    loglevel: debug
  jaeger:
    endpoint: "http://localhost:14250" # Jaeger endpoint
    tls:
      insecure: true
  prometheus:
    endpoint: "0.0.0.0:9464" # Prometheus endpoint
  otlp:
    endpoint: "https://otel-backend.com:4317" # Update for your backend

service:
  pipelines:
    traces:
      receivers: [otlp]
      processors: [batch]
      exporters: [logging, jaeger]
    metrics:
      receivers: [otlp]
      processors: [batch]
      exporters: [prometheus]
✔️ This configuration:
- Receives OTLP traces and metrics.
- Batches telemetry data for efficiency.
- Exports data to Jaeger and Prometheus.
✔️ Once the collector is running:
- Access Jaeger to view traces: http://localhost:16686.
- Scrape metrics via Prometheus: http://localhost:9464/metrics.
5️⃣ If we use a third-party backend like SigNoz, we should configure the exporter in instrumentation.node.ts:
// instrumentation.node.ts

import { OTLPTraceExporter } from '@opentelemetry/exporter-trace-otlp-http';

const traceExporter = new OTLPTraceExporter({
  url: 'https://ingest.us.signoz.cloud:443/v1/traces',
  headers: { 'signoz-ingestion-key': 'YOUR_API_KEY' },
});


6️⃣ To optimize telemetry volume, we should use OpenTelemetry samplers to sample a percentage of traces:
// instrumentation.node.ts

import { ParentBasedSampler, TraceIdRatioBasedSampler } from '@opentelemetry/sdk-trace-node';

const sdk = new NodeSDK({
  sampler: new ParentBasedSampler({
    root: new TraceIdRatioBasedSampler(0.1), // Sample 10% of traces
  }),
  traceExporter,
});
7️⃣ To validate instrumentation, we start our Next.js app locally:
npm run dev
We trigger requests in the app to generate telemetry data and verify them in our configured observability backend (e.g., Jaeger, Prometheus, SigNoz).
By combining Next.js’ built-in OpenTelemetry support with custom configurations and OpenTelemetry Collectors, we can achieve end-to-end observability. This approach allows us to efficiently process, export, and visualize telemetry data with tools like Jaeger, Prometheus, and SigNoz.
Challenges and Future Directions
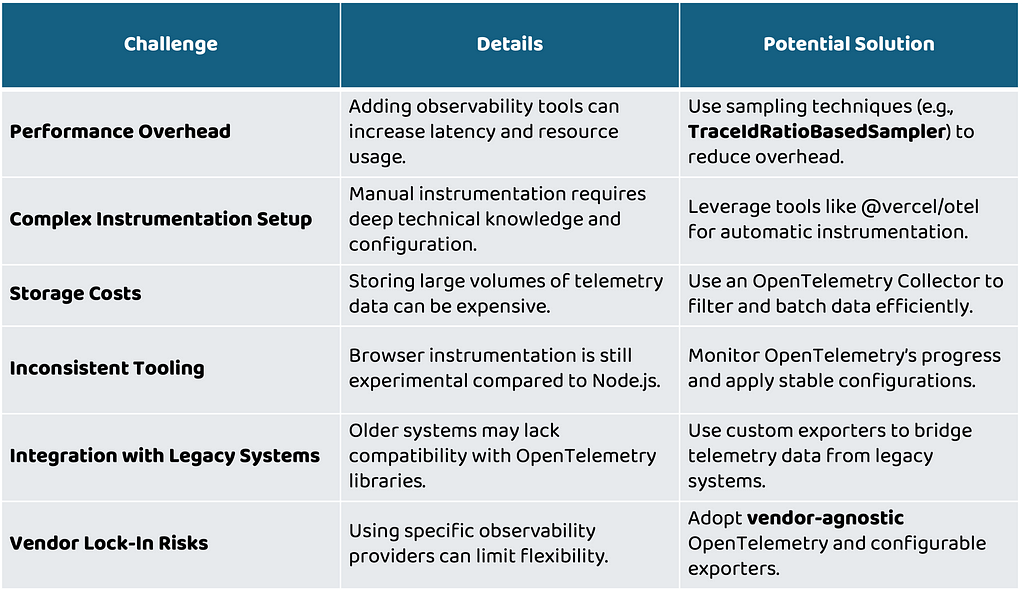
Challenges and Considerations
While OpenTelemetry provides a robust foundation for observability, integrating it with Next.js and other modern frameworks presents several challenges that teams must address:
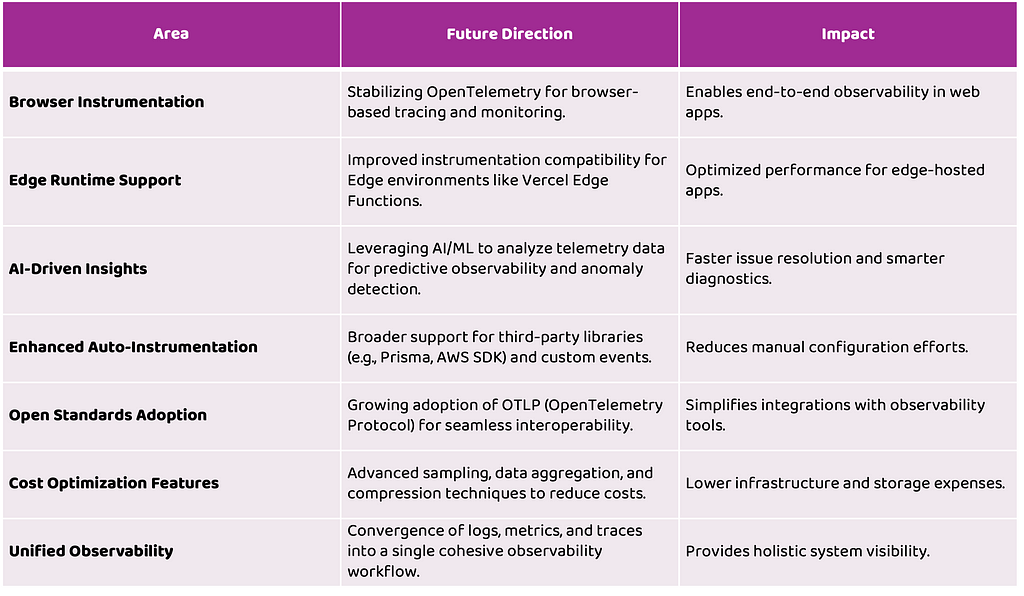
The Future of OpenTelemetry and Next.js Observability
As observability evolves, the collaboration between OpenTelemetry and frameworks like Next.js will continue to drive significant advancements:
OpenTelemetry Adoption Strategies for Ekino
To successfully integrate OpenTelemetry into Ekino workflows and improve the observability of Next.js applications, here are our adoption strategies:
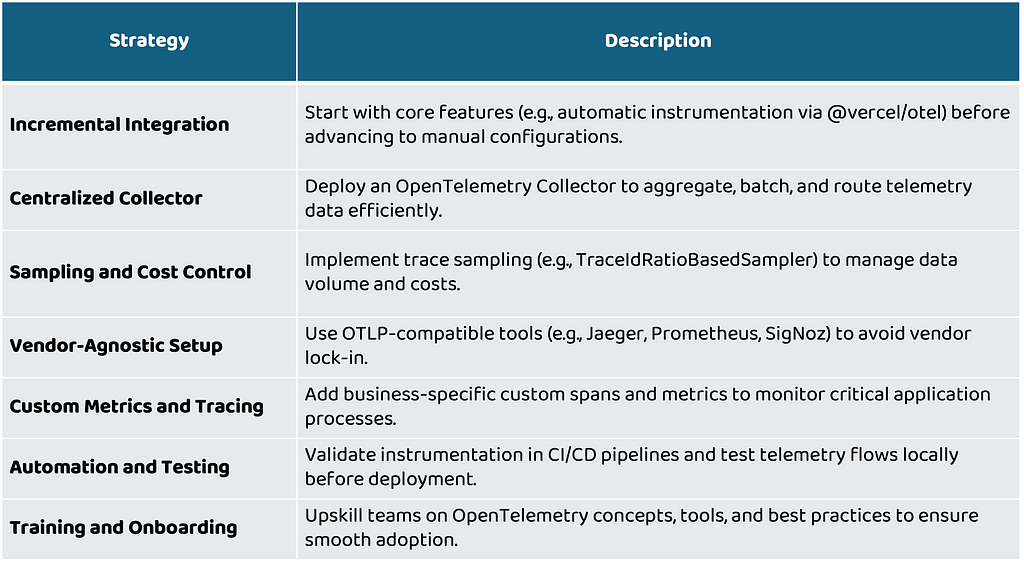
With incremental adoption, centralized collectors, and optimized configurations, we can achieve real-time insights into application performance, reduce debugging time, and deliver exceptional user experiences. The future of observability lies in collaboration between OpenTelemetry, advanced telemetry backends, and evolving frameworks like Next.js.
Conclusion
Observability is no longer a luxury but a necessity for modern web applications, particularly in frameworks like Next.js. By leveraging OpenTelemetry, we can unify metrics, traces, and logs to deliver end-to-end visibility across hybrid architectures.
This case study highlights:
- How OpenTelemetry bridges observability gaps by enabling seamless data collection and analysis.
- Practical strategies for integrating and customizing OpenTelemetry to monitor critical Next.js features like SSR, SSG, and API routes.
- Advanced configurations, including centralized OpenTelemetry Collectors and third-party backends like Jaeger, Prometheus, and SigNoz, to achieve real-time insights and reduce telemetry costs.
For Ekino, the incremental adoption of OpenTelemetry, complemented by optimized sampling strategies and centralized collectors, establishes a robust foundation for scalable improvements in debugging and performance monitoring. At the core of this initiative is Vitality, our innovative project health tool. Vitality integrates multiple tools into a centralized telemetry hub, unifying data collection, streamlining observability, and enabling actionable insights. By leveraging this comprehensive approach, Ekino ensures reliable system performance, efficient issue resolution, and exceptional user experiences.
As OpenTelemetry evolves and Next.js continues to push boundaries, embracing unified observability will remain essential for staying competitive in the ever-changing landscape of modern web applications.
That’s All, Folks! 🚀
Thank you for joining me on this journey into observability with OpenTelemetry and Next.js. ❤️
Want to Connect?
You can find me at GitHub: https://github.com/helabenkhalfallah
Next.js Observability: The OpenTelemetry Case Study was originally published in ekino-france on Medium, where people are continuing the conversation by highlighting and responding to this story.