Xdebug Configuration — PhpStorm / Docker
No matter what programming language you use, you will eventually need a tool to profile your app’s performance, debug your code, and in general improve your developer experience when it comes to solving hard problems.
Xdebug does all this for PHP developers, and it is one of my favorite development tool. Once installed, configured and synced with your IDE, you can start the debugger from your browser or in CLI. You can see exactly what is happening while your code is running, check that everything is working as expected, and, of course, debug the code if it’s not.
That being said, the installation/configuration part of Xdebug can be quite complex and time-consuming, which discourages many people from using it. If this is what’s stopping you from enjoying this amazing tool, here’s a tutorial designed to make it easier!

I use the official PHP image, some adaptations may be necessary if you’re using PHP-fpm, PHP-alpine or other. Also please be aware that this article is intended as a walkthrough for one of the possible Xdebug configuration with Docker in PhpStorm, helping you discover where the settings are. However, other configurations may work just as well.
Configuration
Docker
Check your project’s PHP version in the corresponding Dockerfile and check the Xdebug version compatibility. Since we are using PHP 8.3, we will install Xdebug 3.3 in the container.
Here is what you’ll need in the Dockerfile configuration:
FROM php:8.3

# …

RUN pecl install xdebug-3.3.1
    && docker-php-ext-enable xdebug
    && echo "
xdebug.mode=debug,develop n
xdebug.client_host=host.docker.internal n
xdebug.idekey=PHPSTORM" >> /usr/local/etc/php/conf.d/docker-php-ext-xdebug.ini
RUN rm -f /etc/php/conf.d/xdebug.ini.template
What we do here is the following:
- We install Xdebug with the command from the official documentation
- docker-php-ext-enable xdebug enables Xdebug inside the container (docker-php-ext-enable is an installation helper provided by the PHP docker image as explained on the Docker image’s page)
- We set the variables for the Xdebug configuration and write them to a .ini configuration file for PHP (more details below)
- Finally, we clean the files that are not needed any more
The variables we declare crucial, as they allow us to configure how Xdebug will function:
- xdebug.mode=debug,develop → this sets the variables for the Xdebug modes in order to enable:
1°/ develop mode – to activate Xdebug’s development helpers like the overloaded var_dump
2°/ debug mode – to activate the step debugger - xdebug.client_host=host.docker.internal → this sets the client host (the IP address or hostname) “where Xdebug will attempt to connect to when initiating a debugging connection”. host.docker.internal will resolve “to the internal IP address used by the host”.
- xdebug.idekey=PHPSTORM → this sets the IDE key that Xdebug will send to the debugging client or proxy to connect through the DBGp Proxy tool. As we are going to connect to PhpStorm, we choose to name it with the IDE’s name.
Now let’s build the image and start the container:
# Change directory to your dockerized project
cd path/to/project
# Build the image
docker build -t xdebug-phpstorm-docker .
# Run the container in the background and name it xdebug-phpstorm-docker
docker run -d --rm -p 8080:8000 -v $(pwd):/var/www/html --name xdebug-phpstorm-docker xdebug-phpstorm-docker
Display the content of the docker-php-ext-xdebug.ini file with
docker exec -it {container_name_or_id} cat /usr/local/etc/php/conf.d/docker-php-ext-xdebug.ini
# replace {container_name_or_id} with xdebug-phpstorm-docker for our case
# or use `docker ps` to find out the name or id of your PHP container
The output should be:
zend_extension=xdebug
xdebug.mode=debug,develop
xdebug.client_host=host.docker.internal
xdebug.idekey=PHPSTORM
Once you’re done, check that Xdebug is correctly installed:
docker exec -it {container_name_or_id} php --version
You should get an output similar to the following:
PHP 8.3.11 (cli) (built: Sep  4 2024 22:57:18) (NTS)
Copyright (c) The PHP Group
Zend Engine v4.3.11, Copyright (c) Zend Technologies
    with Xdebug v3.3.1, Copyright (c) 2002-2023, by Derick Rethans
As an example, here is the complete Dockerfile I’m using:
FROM php:8.3

# Install and enable Xdebug
RUN pecl install xdebug-3.3.1
    && docker-php-ext-enable xdebug
    && echo "
xdebug.mode=debug,develop n
xdebug.client_host=host.docker.internal n
xdebug.idekey=PHPSTORM" >> /usr/local/etc/php/conf.d/docker-php-ext-xdebug.ini
RUN rm -f /etc/php/conf.d/xdebug.ini.template

# Set the working directory
WORKDIR /var/www/html

# Copy your application files to the container
COPY . /var/www/html

# Expose chosen port to the outside world
EXPOSE 8000

# Command to run PHP built-in webserver
CMD ["php", "-S", "0.0.0.0:8000"]
PhpStorm
Now that we have a running PHP container with Xdebug installed, let’s configure PhpStorm to handle the debugging connections.
First, open the Debug window in PhpStorm. You will find it in the bottom-left corner, or in the menu bar in View > Tool Windows > Debug.
If we were to start a debugging connection at this point, PhpStorm would display an error message in the Threads & Variables panel: “Remote file path ‘var/www/html/index.php’ is not mapped to any file path in project”.
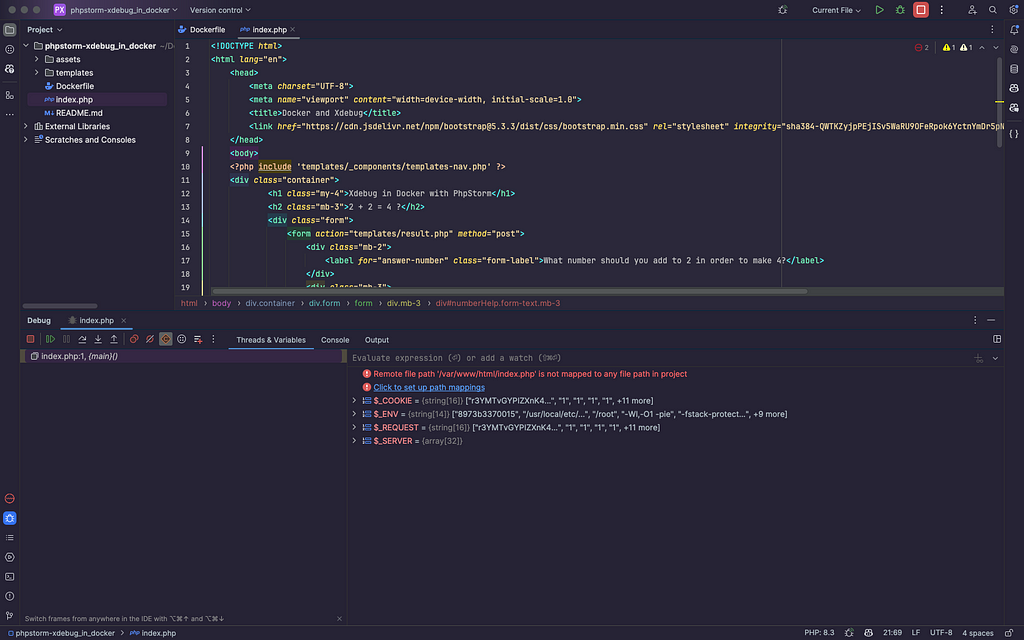
Xdebug needs to know where the entry-point of your application is located, so we will provide this information through some configuration.
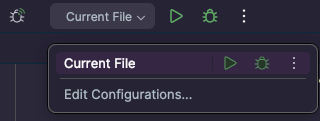
Click in the top-right corner on Edit Configurations.
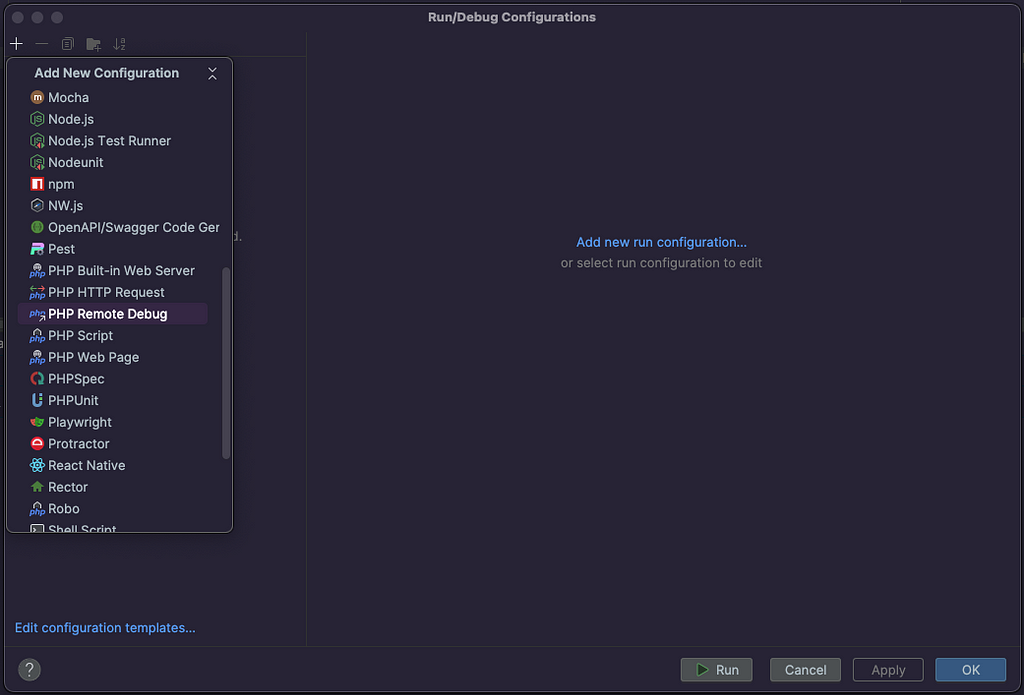
Create a new debug configuration by clicking on the top-left corner “+”, then choose PHP Remote Debug.
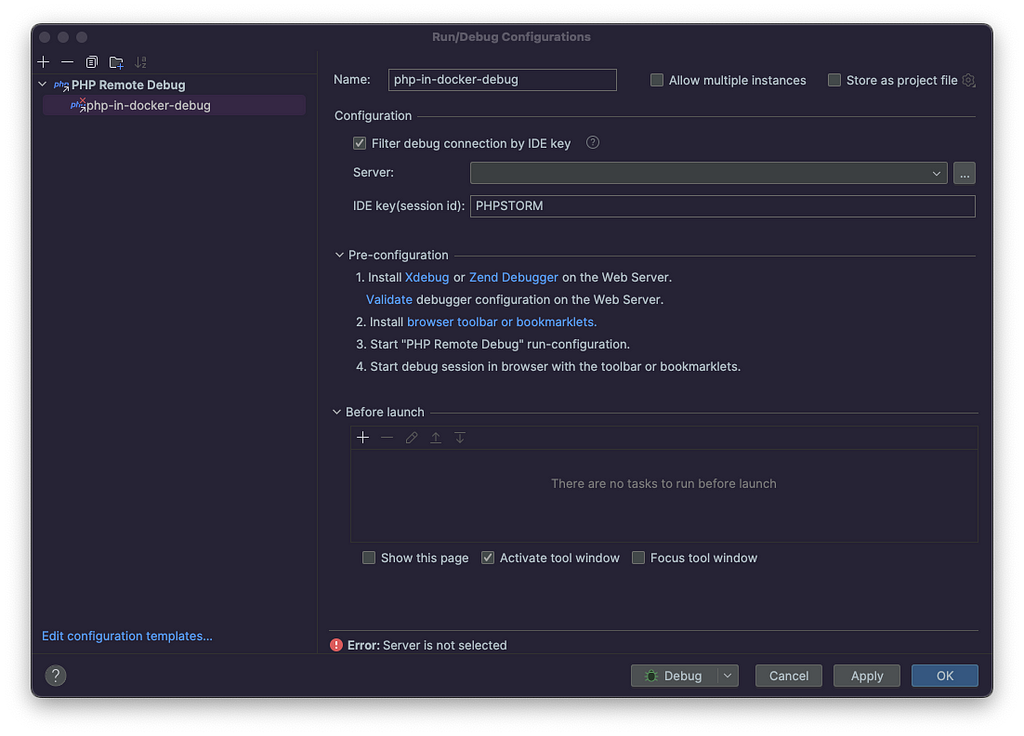
Give your new remote debug configuration a name, check the Filter debug connection by IDE key, fill the IDE key with the one you chose (e.g. PHPSTORM in my case), then click on the 3 dots at the end of the Server field to configure incoming debug connections.
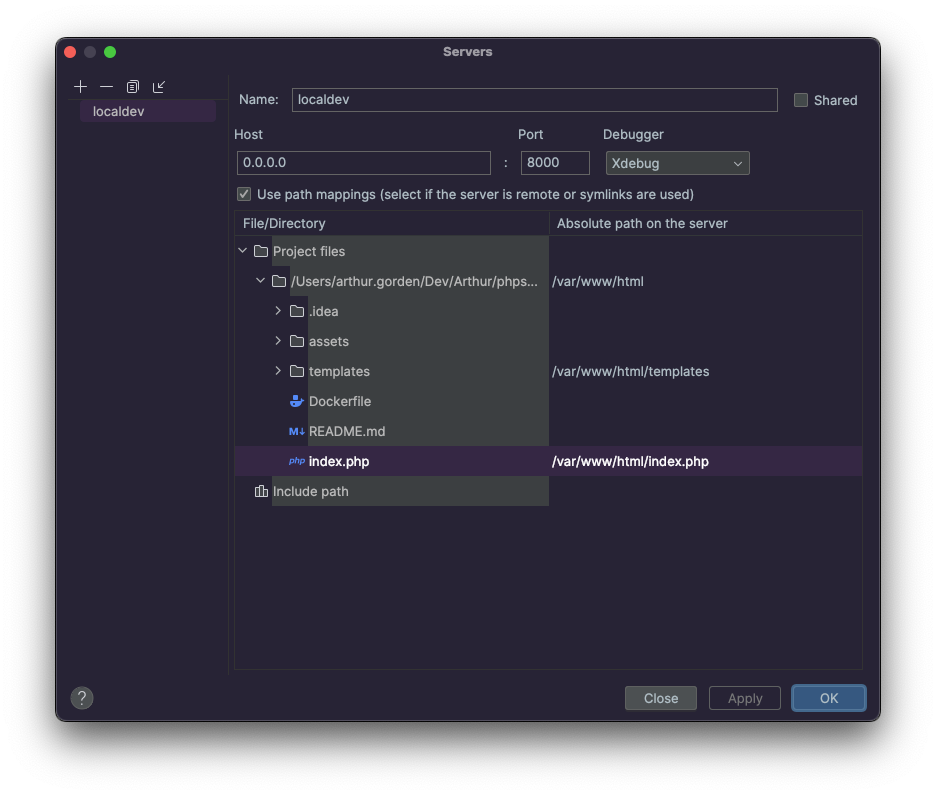
Click on the “+” in the window’s top-left corner and give your debug server a name. Then fill the host (e.g. 127.0.0.1, localhost, or in my case 0.0.0.0) and port (the one exposed by your Docker container, e.g. 8000 in my case) according to your configuration. Refer to your Dockerfile in order to find what host and port should be filled in here.
Finally, tick the Use path mappings checkbox.
The mapping corresponds to the container WORKDIR of your PHP Dockerfile. You can easily check it with:
docker exec -it {container_name_or_id} pwd
Map the root of the project and unfold the Project Files directory so you can map the project’s index.php (or the public directory if it is the entry-point of your application).
Open PhpStorm’s settings.
"Cmd" + "," on Mac
"Ctrl" + "," on Linux and Windows
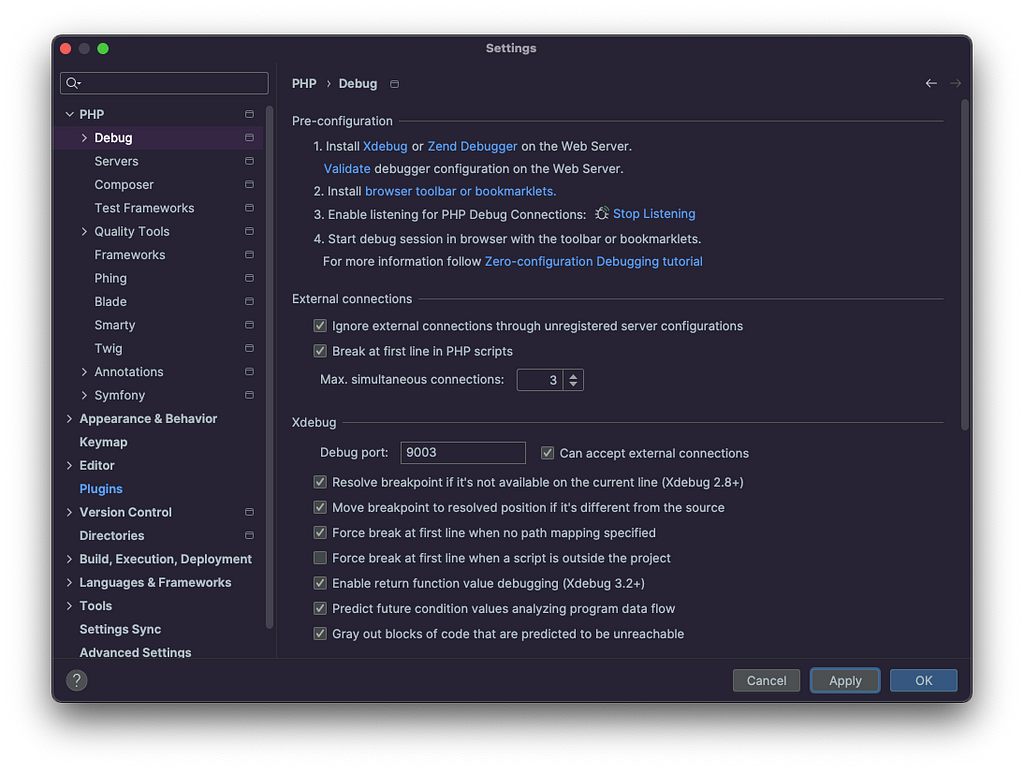
Then, unfold PHP and click on Debug. In the Xdebug part, keep the 9003 port (Xdebug’s port for version 3 and more).
Under the Debug port field, you will see 7 checkboxes (see the screenshot below). They can all be ticked but I would advise you to deselect Force break at first line when a script is outside the project.
When selected, this option forces the step debugger to stop on code outside the project (such as in the vendor directory). In my experience, this can disrupt code execution unexpectedly and tends to be more annoying than helpful.
Start a Debug Session to Test the Connection
To start a debug session:
- Add breakpoints in the code you are about to execute
- Click on the little bug icon in the top right corner of PhpStorm

Then you have two ways of starting the debugger:
- in browsers or API testing tools, you can append the URL with the query parameter XDEBUG_SESSION_START=PHPSTORM (the IDE key). Also for most browsers, you can use a browser extension called Xdebug Helper.
In both case on the first debug session, you might be prompted in PhpStorm to create a new debug server with localhost as server Host parameter. If it happens, do it and don’t forget the path mappings. - in the docker container’s CLI, you can prepend your command with PHP_IDE_CONFIG=serverName=name-of-your-server XDEBUG_CONFIG=bin/console. Please find an example below.
To access the container’s CLI, enter this in your terminal:
docker exec -it {container_name_or_id} bash
In case you have trouble starting the debug session, you can add Xdebug variables directly in the container’s command line. For example, xdebug.start_with_request=yes can be helpful to troubleshoot whether the debug session starts or not:
PHP_IDE_CONFIG=serverName={debug-server-name} XDEBUG_CONFIG=bin/console php -d xdebug.start_with_request=yes -d bin/console your-command
# In our example, replace {debug-server-name} with localdev
All possible Xdebug settings configurable through variables are available here. You might have noticed that these variables are also the ones we used in our Dockerfile.
After confirming that Xdebug is working, you can uncheck the ‘Break at first line in PHP scripts’ setting (in Settings < PHP < Debug). This option was useful for testing the initial step debugger connection, as it forces the debugger to stop on the first line of PHP code it encounters. However, now that you can rely on breakpoints to control where the debugger pauses, it’s no longer necessary to keep it enabled.
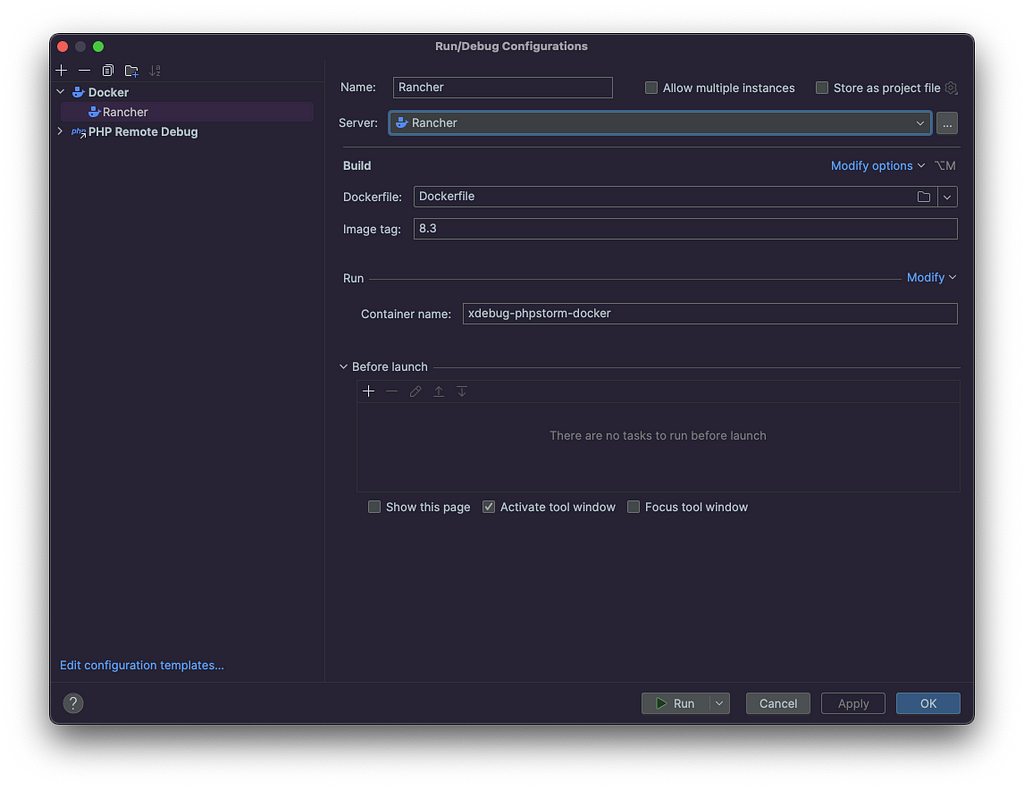
Also, if you have trouble configuring Xdebug with Docker in PhpStorm and you are not (yet) a Docker professional, try the Docker Plugin in PhpStorm. This can be helpful:
- to debug the debugger connection as the plugin allows easy access to the containers’ logs and command line.
- to create an alternative debugging configuration based on the Dockerfile.
Finally! You’re done!
Thanks a lot for reading, I hope this tutorial has been helpful and that you will enjoy using Xdebug as much as I do!
As a debugging tool, you will discover that Xdebug is very effective, but keep in mind that you can also use it for other purposes, for example helping you better understand a new project or discover a new library.
Because one article is sometimes (often) not enough, please find other useful resources here:
- Xdebug 3 Documentation Youtube series, by Xdebug’s creator Derick Rethans, and its video about Xdebug in Docker and PhpStorm
- How to use Xdebug in Docker & PhpStorm by Nicolas Valverde, a very good tutorial published by Sensiolabs Tech Blog on Medium
- Xdebug in PhpStorm on Docker environments by Belgeek
Xdebug Configuration — PhpStorm / Docker Desktop was originally published in ekino-france on Medium, where people are continuing the conversation by highlighting and responding to this story.
